Graph Settings Example Screen
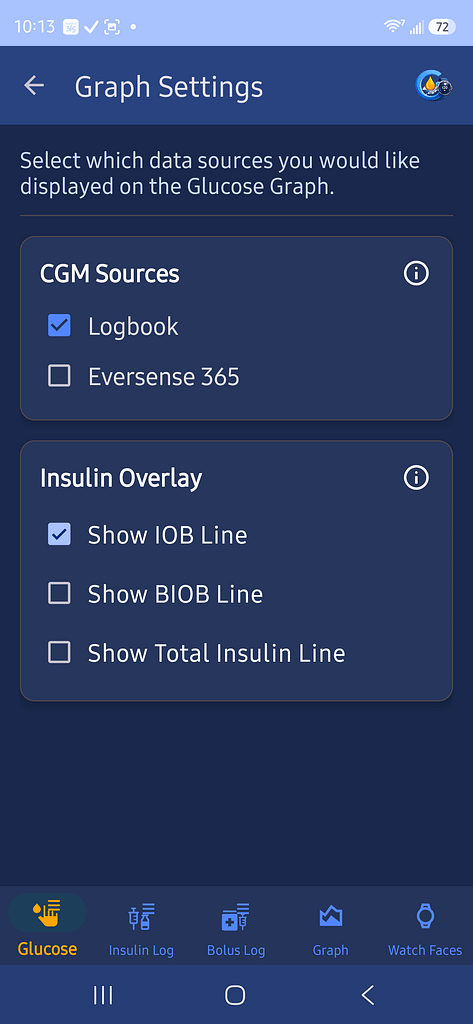
Use Graph Settings to choose which data appears on the Glucose Graph.
CGM Sources
Select the glucose sources you want displayed on the graph.
Available sources depend on the apps, sensors, and users configured in GlucoGlance.
Examples may include:
- Logbook
- Primary CGM
- Follow users
Logbook data and sensor data are mutually exclusive and cannot be displayed together.
Insulin overlays can be displayed with either Logbook data or sensor data.
Insulin Overlay
Choose which insulin information is displayed with the glucose data.
Show IOB Line
Displays Insulin on Board over the glucose graph.
Show BIOB Line
Displays Basal Insulin on Board over the glucose graph.
Show Total Insulin Line
Displays total insulin over the glucose graph.
Turn each option on or off independently.